Main Keyboard Shortcuts When Working with the ABAP Debugger
Main Keyboard Shortcuts When Working with the ABAP Debugger
In this note, I’ll go over the main keyboard shortcuts used in the ABAP debugger and describe a few actions that can be useful during debugging in general.
Starting the Debugger – Option 1
The most common and simple way to start debugging is by entering the system command /h. This command should be executed before you plan to start debugging. For example:
Starting the Debugger – Option 2
Debugging can also be initiated through other interesting techniques.
See also:
- How to start ABAP program debugging for a user?
- How to set an external breakpoint for a user?
- SAP Workflow. Debugging Background Tasks
Debugging Popup Windows
In some ABAP programs, a popup window may appear. If you want to start debugging right after that popup appears, you need to create a simple text file with the following content:
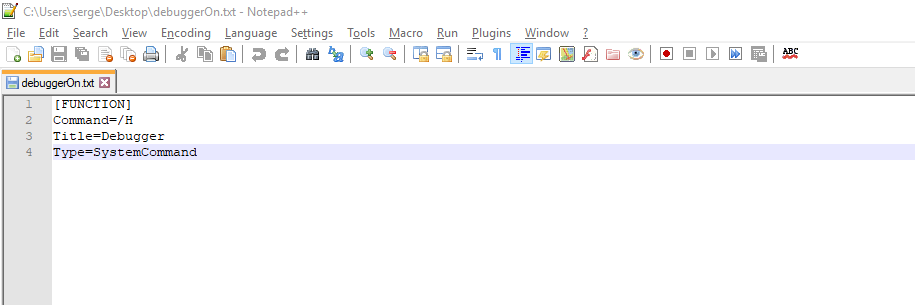
[FUNCTION]
Command=/H
Title=Debugger
Type=SystemCommand
Then drag and drop this file onto the popup window in the ABAP program.
Debugging: F5 Key
Use F5 to step through the program line by line, including into function modules, class methods, conditions, etc. For example:
Debugging: F6 Key
Use F6 to skip over code blocks. For example, if you're at a function module call, F6 will execute the FM and show the result without stepping into it.
Debugging: F7 Key
Use F7 to return to the main program from the depths you've entered using the other step functions. For example:
Debugging: F8 Key
F8 will continue execution until the next breakpoint or the logical end of the program. For example:
Debugging: Shift + F12
Shift + F12 allows you to jump to a specific line in the code, skipping over code that won’t be executed. For example:
Setting Breakpoints During Debugging
To make a breakpoint persistent across debugging sessions:
- Start the debugger
- Navigate to the desired line
- Set a breakpoint
- Press Ctrl + S to save it
- Restart debugging
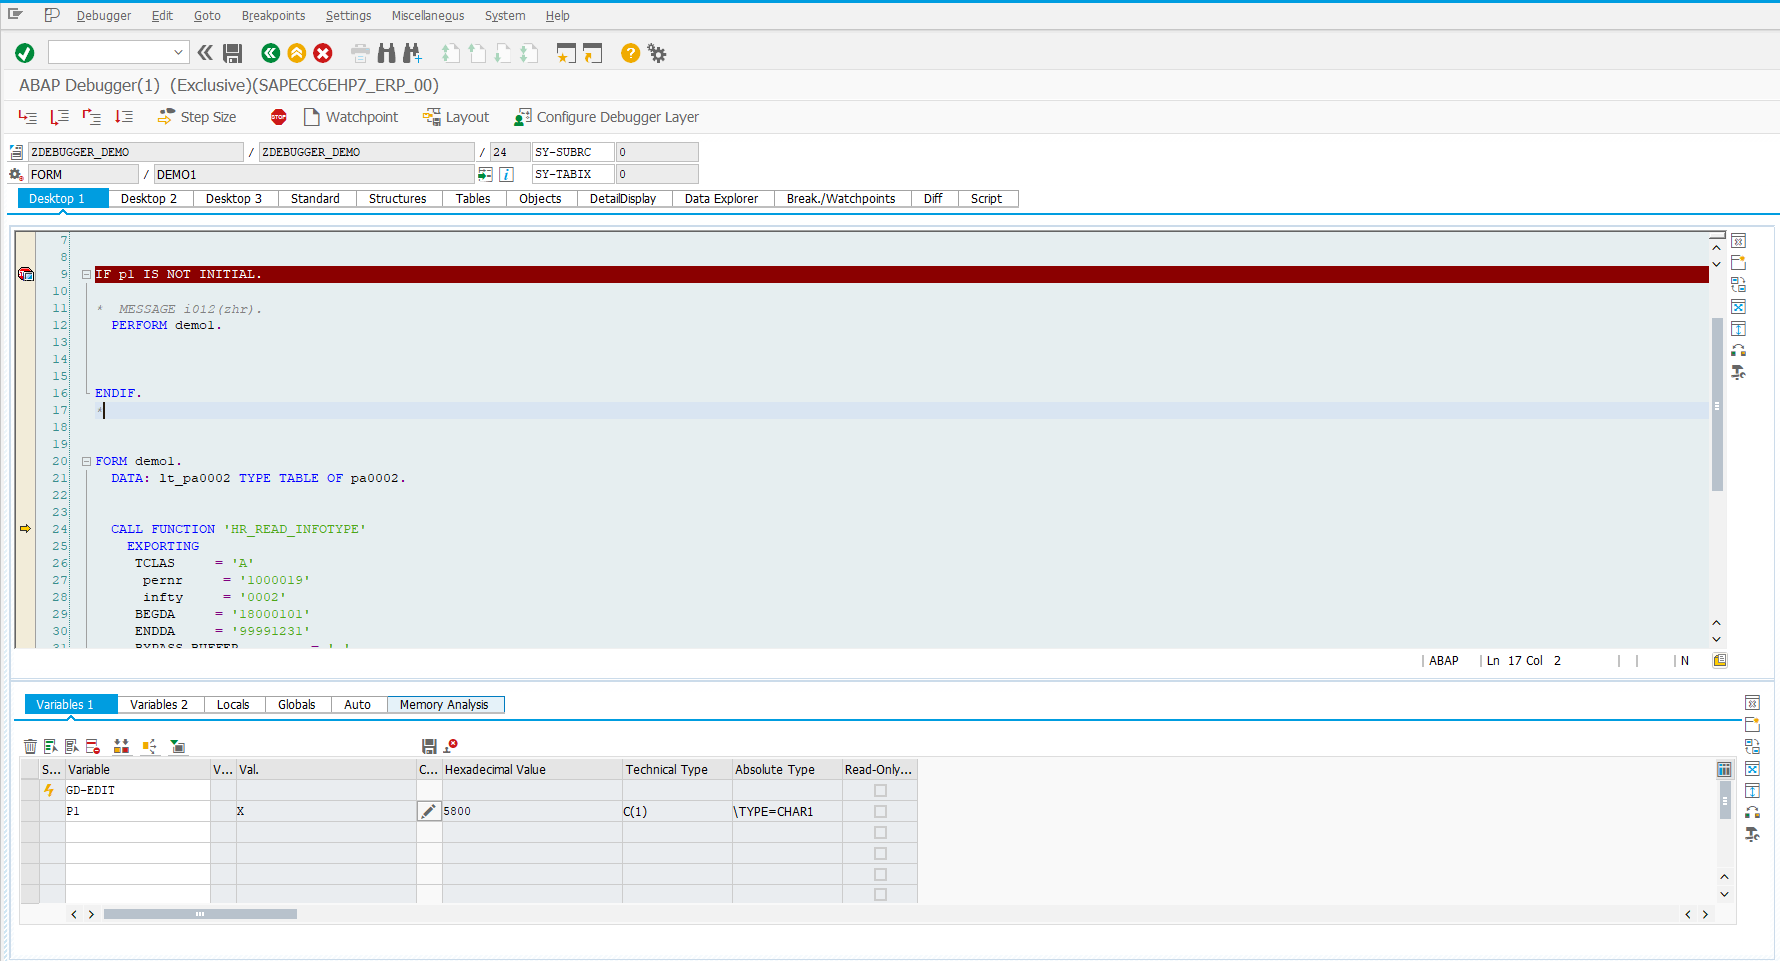
Saving Variables in the Watch Panel
If you frequently view the same set of variables, you can pin or save them in the watch panel to avoid adding them every time. Just press the Save button after adding them. For example:
Watchpoint for a Variable
See: How to Set a Watchpoint for a Variable in the ABAP Editor?
Debugging an ABAP Program for Another User (Not an External Breakpoint)
See: How to start ABAP program debugging for a user?
Call Stack
To see the call stack that led to the current point in the code, open Desktop 2.
See: Layout of the User Interface
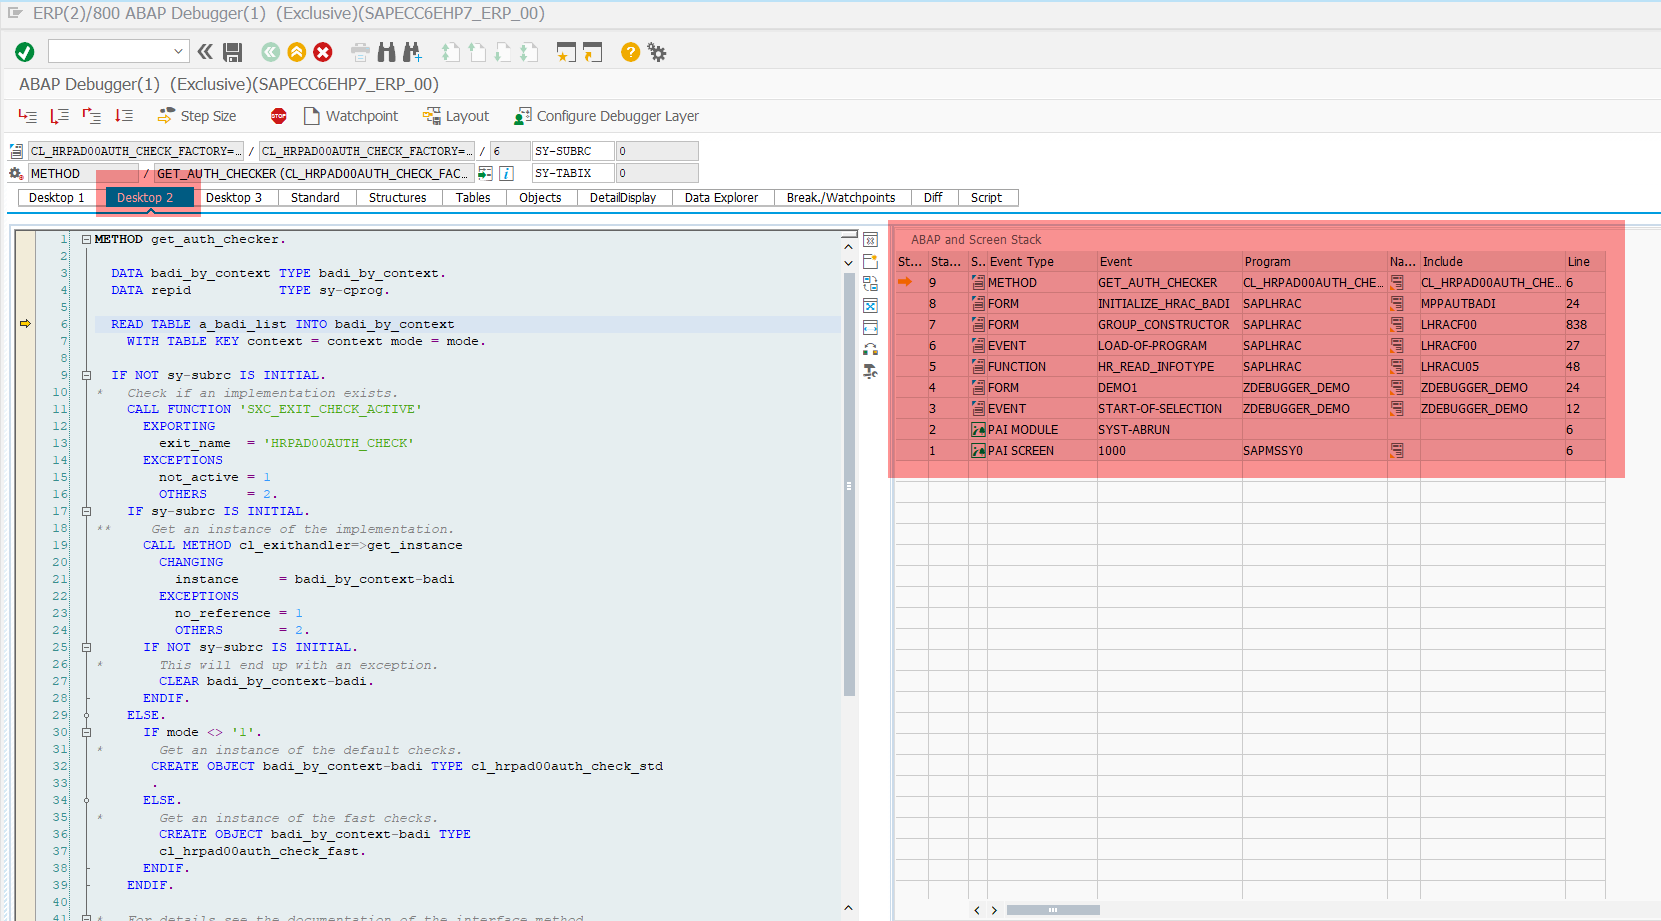
You can also navigate through the call stack, which is very handy.
Changing Layout from Horizontal to Vertical
Admittedly, not the most elegant title. But you may have encountered this layout issue when launching the debugger in a new system, and the layout looks “off.”
This layout can be annoying. To fix it, follow the guide in:
See: Designing Work Areas
Searching in Web Dynpro Methods
To quickly search through component controller methods in a Web Dynpro app without opening each method, go to SE80 → Utilities → Settings…
See: The Controllers of a Web Dynpro Component
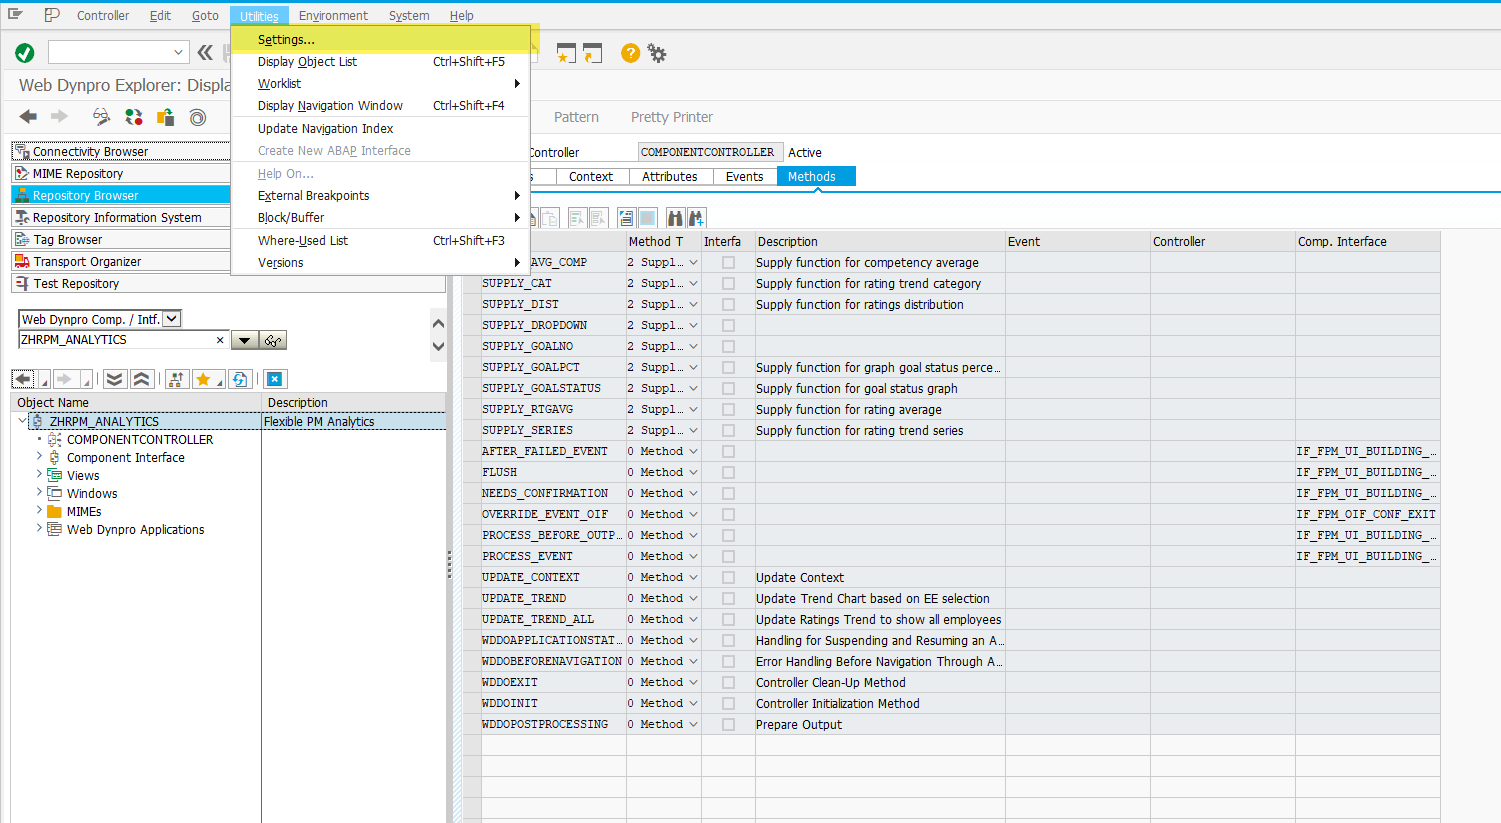
Then go to the Web Dynpro tab and uncheck Method-Based Editor.
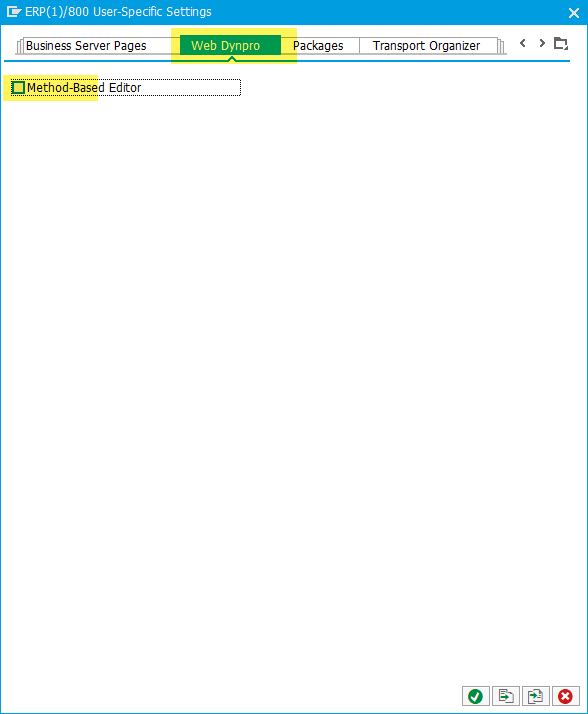
This will allow faster navigation. There's also a video showing the before/after effect.
Vendor Documentation
See: New ABAP Debugger
That was awesome! Thanks for your time and attention. Hugs, ignatov.